Comparing Europe’s Tax Systems: Individual Taxes
Our recently published 2022 International Tax Competitiveness Index (ITCI) measures and compares how well OECD countries promote sustainable economic growth and investment through competitive and neutral tax systems. This week, we examine how European OECD countries rank on individual taxes, continuing our series on the ITCI’s component rankings.
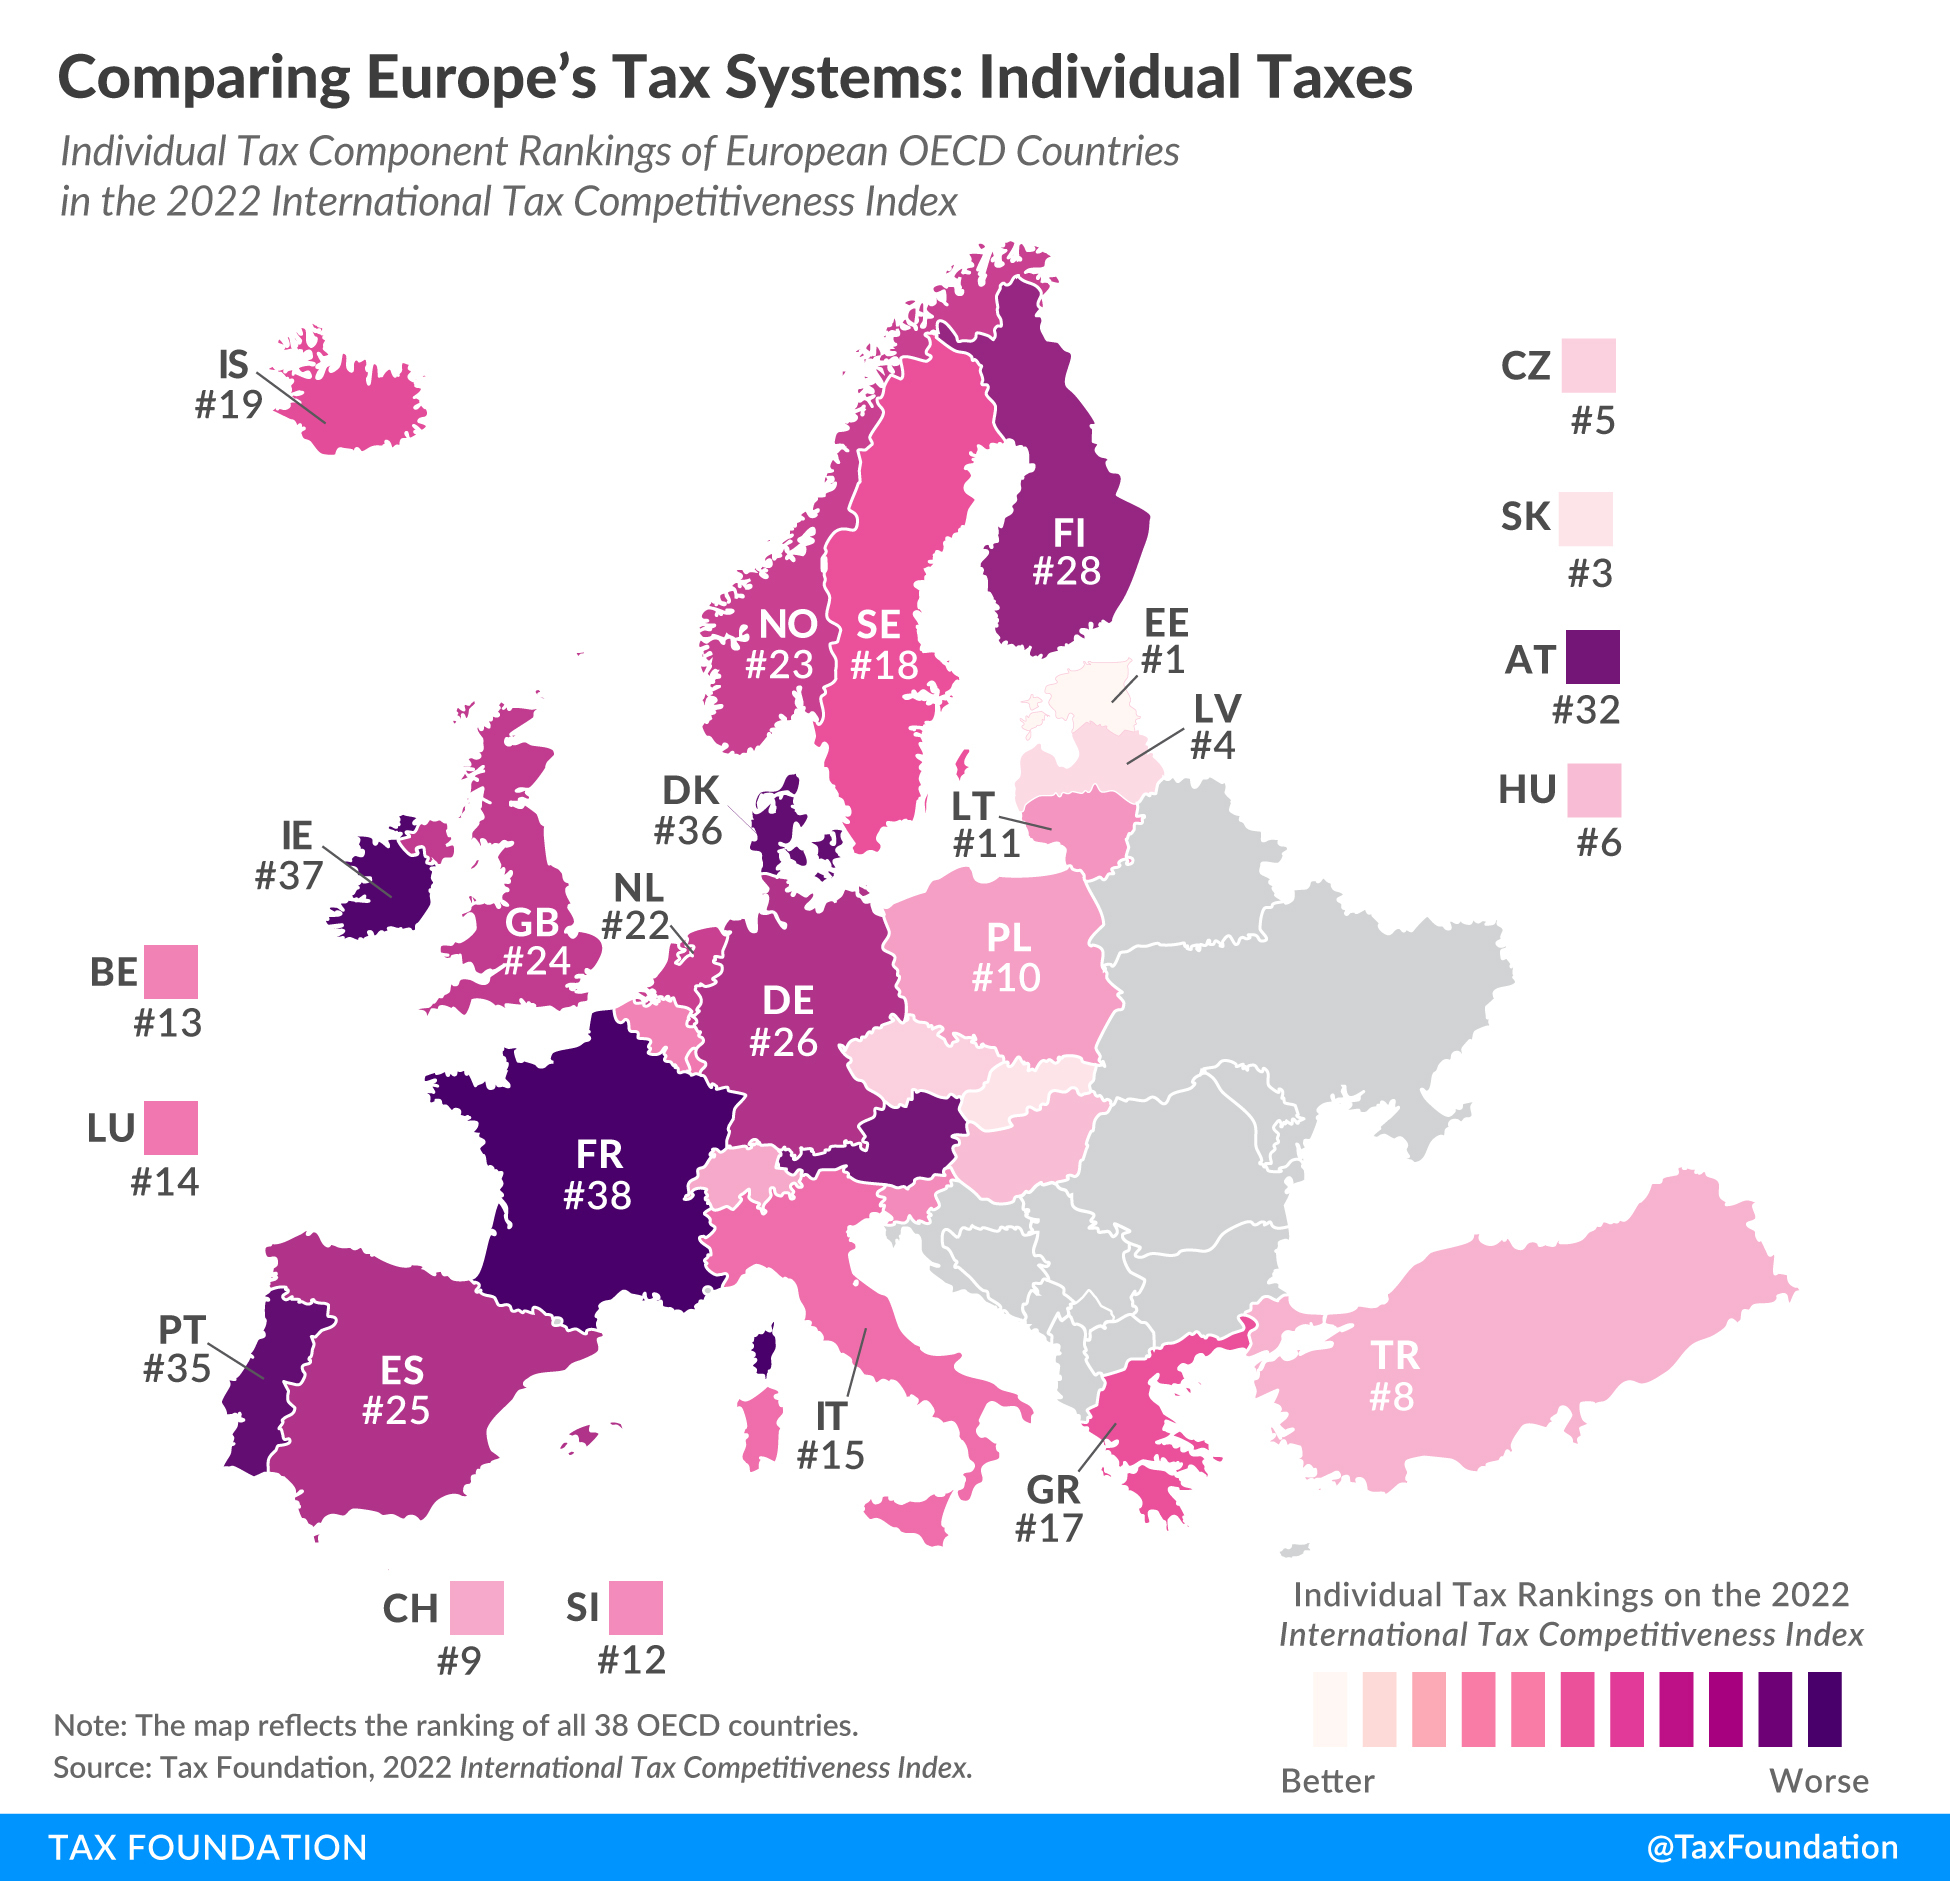
The ITCI’s individual tax component scores OECD countries on their top marginal individual income tax rates and thresholds, how complex the income tax is, and the tax rates levied on income from capital gains and dividends.
Estonia has the most competitive individual tax system in the OECD. The Baltic country levies a top marginal income tax rate of 20 percent on wage income, the second lowest rate in the OECD. Estonia applies the top rate at 0.33 times the average national income, making it a relatively flat income tax.
Estonia’s labor tax payments are largely automated, resulting in one of the easiest income tax systems to comply with in the OECD. Estonian policymakers prioritize simplicity which is consistently evident throughout the tax code.
Due to Estonia’s cash-flow tax on business profits, there is no separate levy on dividend income, setting the dividends tax rate to zero percent. Capital gains are taxed at a rate of 20 percent, close to the OECD average of 19 percent and aligned with its corporate tax.
In contrast, the French individual income tax system is the least competitive of all OECD countries. France’s top marginal tax rate of 45.9 percent is applied at 14.7 times the average national income. Additionally, a 9.7 surtax is applied to those at the upper end of the income distribution. Capital gains and dividends are both taxed at comparably high top rates of 34 percent.
Click here to see an interactive version of OECD countries’ individual tax rankings, then click on your country for more information about the strengths and weaknesses of its tax system.
To see whether your country’s individual tax rank has improved in recent years, check out the table below. To learn more about how we determined these rankings, read our methodology here.
| Country | 2020 Rank | 2021 Rank | 2022 Rank | Change from 2021 to 2022 |
|---|---|---|---|---|
| Australia (AU) | 19 | 19 | 20 | -1 |
| Austria (AT) | 34 | 30 | 32 | -2 |
| Belgium (BE) | 13 | 13 | 13 | 0 |
| Canada (CA) | 28 | 32 | 31 | 1 |
| Chile (CL) | 26 | 29 | 34 | -5 |
| Colombia (CO) | 3 | 10 | 2 | 8 |
| Costa Rica (CR) | 33 | 35 | 33 | 2 |
| Czech Republic (CZ) | 1 | 1 | 5 | -4 |
| Denmark (DK) | 36 | 37 | 36 | 1 |
| Estonia (EE) | 4 | 3 | 1 | 2 |
| Finland (FI) | 30 | 31 | 28 | 3 |
| France (FR) | 38 | 36 | 38 | -2 |
| Germany (DE) | 27 | 28 | 26 | 2 |
| Greece (GR) | 29 | 27 | 17 | 10 |
| Hungary (HU) | 7 | 6 | 6 | 0 |
| Iceland (IS) | 22 | 26 | 19 | 7 |
| Ireland (IE) | 37 | 38 | 37 | 1 |
| Israel (IL) | 32 | 33 | 30 | 3 |
| Italy (IT) | 17 | 18 | 15 | 3 |
| Japan (JP) | 18 | 17 | 16 | 1 |
| Korea (KR) | 16 | 15 | 27 | -12 |
| Latvia (LV) | 6 | 4 | 4 | 0 |
| Lithuania (LT) | 11 | 11 | 11 | 0 |
| Luxembourg (LU) | 15 | 14 | 14 | 0 |
| Mexico (MX) | 31 | 20 | 29 | -9 |
| Netherlands (NL) | 21 | 24 | 22 | 2 |
| New Zealand (NZ) | 5 | 5 | 7 | -2 |
| Norway (NO) | 20 | 22 | 23 | -1 |
| Poland (PL) | 10 | 9 | 10 | -1 |
| Portugal (PT) | 35 | 34 | 35 | -1 |
| Slovak Republic (SK) | 2 | 2 | 3 | -1 |
| Slovenia (SI) | 12 | 12 | 12 | 0 |
| Spain (ES) | 14 | 16 | 25 | -9 |
| Sweden (SE) | 25 | 23 | 18 | 5 |
| Switzerland (CH) | 9 | 8 | 9 | -1 |
| Turkey (TR) | 8 | 7 | 8 | -1 |
| United Kingdom (GB) | 23 | 25 | 24 | 1 |
| United States (US) | 24 | 21 | 21 | 0 |

- The Benefits of Meal Prepping for Busy Moms - October 28, 2023
- The 11 Best Cash ETFs in Canada (Plus HISA ETFs and Money Market ETFs) - October 8, 2023
- Build a Variety of Outfits with These 7 Affordable Pieces - October 7, 2023